King Faisal Specialist Hospital now forecasts emergency department demand 24 hours in advance using AI, and reports that time to see a physician has fallen 42%, according to a Yahoo Finance report carried on Google News. The headline is clinical, but the mechanism is operational: the hospital stopped sizing capacity after patients arrived and started sizing it the day before. That same mechanism is available to every doctor-at-home and lab-at-home operator running vans, slots and phlebotomists across Dubai, Abu Dhabi, Doha or Manama.
The shift is from reaction to pre-positioning
An emergency department cannot refuse arrivals, so its only defence against a surge is how many clinicians are on the floor at the hour the surge lands. A home-visit operation is the mirror image: it can only serve what the published roster allows, which means a bad forecast shows up as either paid staff sitting idle or booking requests quietly turned away. Both are invisible on a profit and loss statement that only counts completed visits.
What a 24-hour horizon buys is not prediction for its own sake. It buys enough lead time to change something that is still changeable, staggered shift start times, an extra phlebotomist called in, a third vehicle released, more 06:00 fasting slots opened on the booking page, or a deliberate decision to keep slots closed in a cluster where travel time will eat the margin. Forecasts with a horizon shorter than the decision they feed are decoration. A roster published every evening for the next day is exactly the kind of decision a 24-hour forecast can move, which is why that horizon keeps appearing in operational AI deployments rather than week-ahead or month-ahead models.
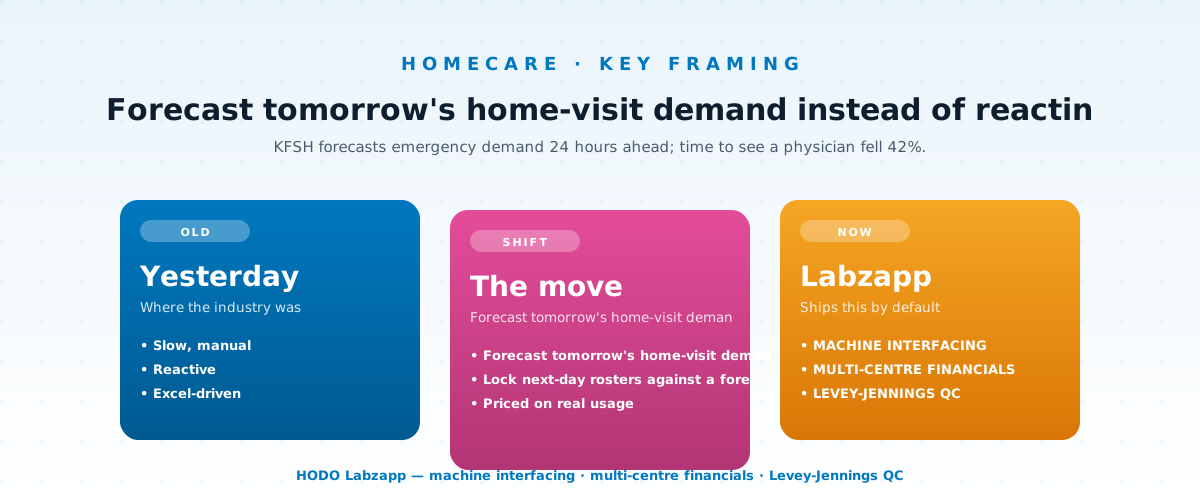
Forecast tomorrow's home-visit demand instead of reacting to it.
Home-visit demand is more predictable than an emergency department
Emergency presentations are close to the hardest forecasting problem in healthcare, and KFSH still found enough signal to act on. Home-visit demand carries far more structure. Bookings arrive with lead time rather than by ambulance. Fasting profiles cluster into a narrow pre-breakfast window. Corporate and pre-employment screening lands in batches that a sales team already knows about. Chronic-care repeat patients run on 30-day and 90-day cycles that are visible in the record.
GCC operators also have calendar structure that is specific to the region and strong enough to dominate any model: a Friday-to-Sunday weekend shape that differs across Saudi Arabia, the UAE and Qatar; Ramadan collapsing collection demand into pre-dawn and post-iftar windows; summer months where afternoon travel times and patient willingness to open the door both change; school-screening and insurance renewal seasons; and the mid-year outflow of expatriate families. Fourteen to twenty weeks of booking history is usually enough to see day-of-week and hour-of-day shape per area. Most operators already hold that data in their booking system and have never pulled it into a table.
The roster is the cost line a forecast protects
Cost per home visit in the GCC is set almost entirely by fixed daily inputs: salary, accommodation, visa and insurance for the collection staff, vehicle lease, fuel, Salik or toll charges, consumables and the back-office share. A two-person unit with a vehicle might sit somewhere around a four-figure dirham figure per working day once everything is loaded. At eight completed visits that day, the cost per visit is roughly double what it is at twelve. No test-price negotiation or partner discount moves the number that much.
That makes visits per route-day the metric that matters, and idle minutes between visits the thing a forecast is actually buying down. Three numbers are worth putting on a daily sheet: completed visits per staff-day, idle and travel minutes as a share of the shift, and requests that were declined or shifted to a later date, broken down by hour and area. The third is the one almost nobody captures, and it is the one that tells an operator whether yesterday's roster was too small.
Forecast into the route, not just the headcount
A city-level forecast that is accurate in total can still produce a route that is wrong. Demand needs to be forecast at the cluster an actual van serves, Al Barsha and Jumeirah, Khalifa City and Al Reem, West Bay and Al Sadd, because two visits sixteen kilometres apart in afternoon traffic cost more than four visits inside one community. Cluster-level forecasting also makes slot design possible: fasting collections grouped into the early window, corporate batches mid-morning, doctor-at-home visits weighted to evening when a working patient is actually home.
The constraint that route planners forget is the return leg. A route optimised for driving time can still miss the laboratory cut-off that feeds the analyser batch, and a missed batch pushes turnaround past the promise made at booking. Sample receipt timestamps at the lab, read against collection timestamps on the route, show precisely which clusters and which shift patterns break the cut-off. Chain of custody and turnaround are the same data problem viewed from two ends, and both belong in the forecast rather than in an apology to the patient.
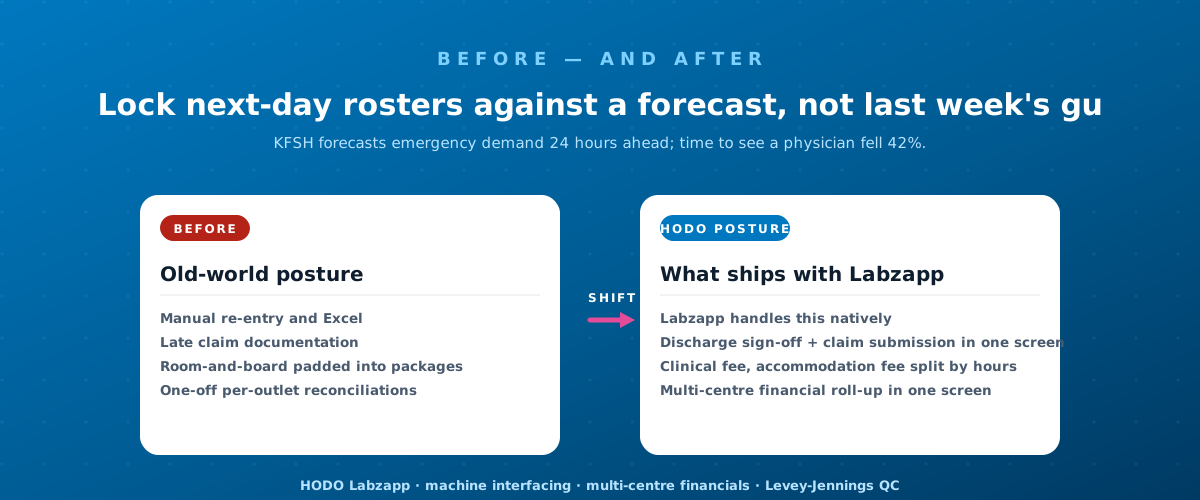
Lock next-day rosters against a forecast, not last week's guess.
Start with the honest baseline, not the model
Before any vendor conversation, an operator should compute the naive baseline: predict tomorrow using the same weekday last week, then measure the error. Any model worth paying for has to beat that, per cluster, over at least a month of live days. Many operators discover that the baseline is already good enough for the roster decision, and that the real gap is in acting on it rather than in sharpening it.
The second check is whether the demand history is censored. A booking log records served demand, not demand. If slots were closed, if the call centre stopped answering at 19:00, or if a cluster was never offered, the data understates the market in exactly the places where expansion would pay. Capturing turn-aways, cancellations with reasons, and reschedule requests converts a sales record into a demand record. Without that, a forecasting project trains a model to reproduce last quarter's capacity ceiling and calls it a prediction.
What this means for HODO customers
The operational spine for this sits in Labzapp. Phlebotomy/home-collection workflows capture booking, assignment, collection and hand-over events with timestamps, which is the raw material any forecast needs and the record that chain of custody depends on. Barcoded samples tie a physical tube to the collection time, the route and the receiving centre, so a missed analyser batch can be traced to a shift pattern instead of a person. TAT reporting turns those timestamps into a per-cluster view of whether the promise made at booking is being met, and automated SMS/WhatsApp/Email report delivery closes the loop without a coordinator chasing it. Multi-centre financials then put cost per visit next to visits per route-day, which is where the roster decision is finally settled.